JetBrains IDEs
- Local
- Remote
Cascade では、IDE から直接診断ファイルを生成できます。方法は次の 2 通りです:
- Cascade ウィンドウ右上の 3 点メニューをクリックし、Download Diagnostics を選択
- IDE メニューの Tools > Windsurf > Download Windsurf Diagnostics を選択
VS Code
-
コマンド パレット(
Ctrl/Cmd + Shift + Pまたは View > Command Palette)を開きます - “Show logs” と入力し、“Developer: Show Logs” と表示されるオプションを選択します
- 右上のドロップダウンで “Extension Host” を “Windsurf” に変更します
- 次の画像のように表示されます:
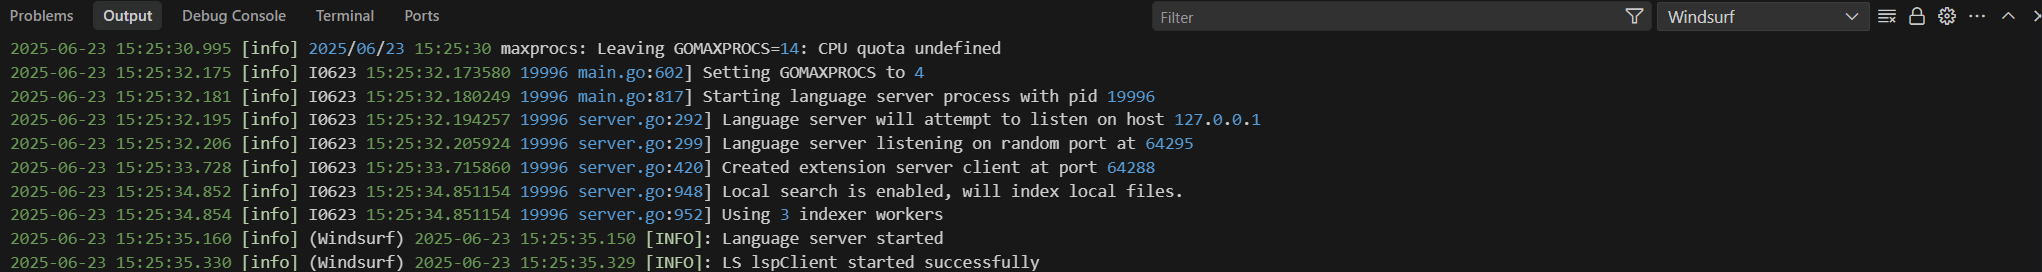
- ログをエクスポートするか、コピーします
Eclipse
- Mac/Linux: ~/.codeium/codeium.log
- Windows: C:\Users<username>.codeium\codeium.log
Visual Studio
NeoVim
g:codeium_log_file にファイルのパスを設定し、Vim を再起動してください。
その後、ログはそのファイルに出力されるようになります。