If you’re having issues, the first step in the troubleshooting process is to retrieve the logs from your IDE. Here’s how you can get Windsurf logs for each of the major IDEs:Documentation Index
Fetch the complete documentation index at: https://docs.windsurf.com/llms.txt
Use this file to discover all available pages before exploring further.
JetBrains IDEs
- Local
- Remote
Cascade has now the option to generate a diagnostics file directly from the IDE, there are 2 ways to do so:
- In the Cascade window, click on the 3 dots in the upper right side, and select Download Diagnostics
- In the IDE menu, go to Tools > Windsurf > Download Windsurf Diagnostics
VS Code
-
Go to the Command Palette (
Ctrl/Cmd + Shift + Por go to View > Command Palette) - Type in “Show logs” and select the option that reads “Developer: Show Logs”
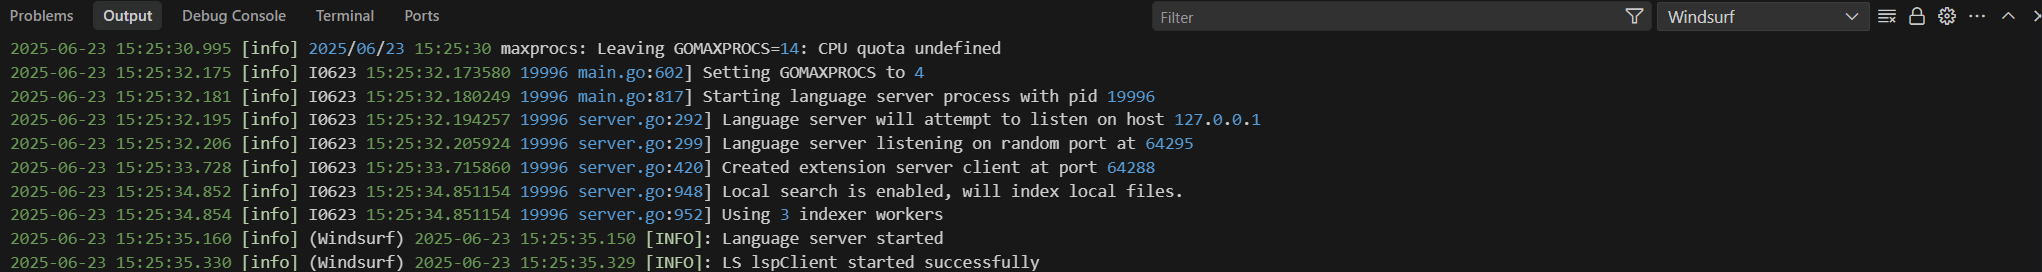
- Change the dropdown in the top right that reads “Extension Host” and select “Windsurf”
- You should see something similar to the image below:
- Export or copy the logs
Eclipse
In Eclipse, logs are written to the following paths:- Mac/Linux: ~/.codeium/codeium.log
- Windows: C:\Users<username>.codeium\codeium.log
Visual Studio
Go to view > output, select “Windsurf” in the dropdown, and copy the logs.NeoVim
Setg:codeium_log_file to a path to a file in their vimrc and then relaunch vim.
Then the logs should be written to that file.