> ## Documentation Index
> Fetch the complete documentation index at: https://docs.windsurf.com/llms.txt
> Use this file to discover all available pages before exploring further.
# 收集插件日志
> 如何从 JetBrains、VS Code、Eclipse、Visual Studio 和 NeoVim 收集诊断日志,以排查 Windsurf 插件问题。
如果你遇到问题,排查的第一步是从 IDE 中获取日志。以下是在主流 IDE 中获取 Windsurf 插件日志的方法:
## JetBrains IDEs
Cascade 现在支持直接在 IDE 中生成诊断文件,有两种方式:
* 在 Cascade 窗口右上角点击“三点”图标,选择 Download Diagnostics
* 在 IDE 菜单中依次选择 Tools > Windsurf > Download Windsurf Diagnostics
推荐使用第一种方式,因为它还会包含 Cascade 内嵌浏览器的日志。
点击该按钮会自动收集相关日志和参数并保存为一个文本文件。
在极端情况下,你也可以通过 Help > Show Log in Explorer/Finder 获取 IDE 的完整日志(idea.log)。
要收集 Windsurf 诊断,你可以使用以下方式:
* 在 Cascade 窗口右上角点击“三点”图标,选择 Download Diagnostics
* 在 IDE 菜单中依次选择 Tools > Windsurf > Download Windsurf Diagnostics
推荐使用第一种方式,因为它还会包含 Cascade 内嵌浏览器的日志。
此外,如需收集完整的 IDE 日志:
* 在 IDE 菜单中依次选择 Tools > Windsurf > Collect Host and Client Logs
## VS Code
1. 打开命令面板(`Ctrl/Cmd + Shift + P`,或依次选择 View > Command Palette)
2. 输入 “Show logs”,并选择 “Developer: Show Logs” 选项
3. 将右上角的下拉菜单从 “Extension Host” 切换为 “Windsurf”
4. 你应会看到与下图类似的内容:
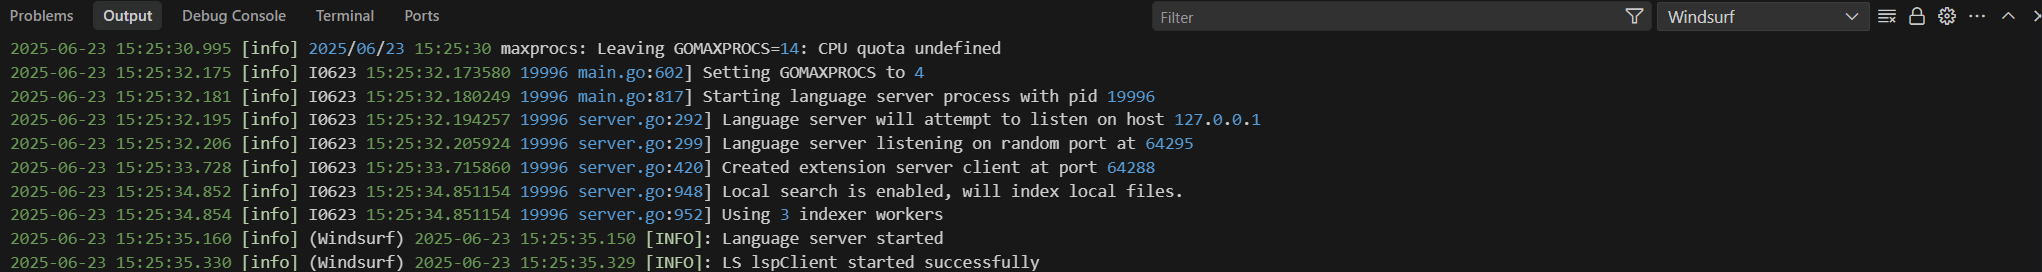 5. 导出或复制日志
## Eclipse
在 Eclipse 中,日志会写入以下路径:
* **Mac/Linux**:\~/.codeium/codeium.log
* **Windows**:C:\Users\.codeium\codeium.log
## Visual Studio
前往 **View > Output**,在下拉菜单中选择“Windsurf”,然后复制日志。
## NeoVim
在 vimrc 中将 `g:codeium_log_file` 设置为某个文件的路径,然后重新启动 Vim。
之后,日志将写入该文件。